


OpenTelemetry Collector位于OpenTelemetry架构的核心位置,但与W3C Trace Context无关。在我的追踪演示中,我选择使用Jaeger而非Collector。尽管如此,它在每篇OpenTelemetry相关文章中都无处不在,激发了我进一步探索的兴趣。
本篇文章中,我将深入探讨Collector的各个方面:
- 数据类型:日志、指标和追踪
- 推送与拉取模型
- 操作:读取、转换和写入
入门步骤
A long time ago, observability as we know it didn’t exist; what we had instead was monitoring. Back then, monitoring was a bunch of people looking at screens displaying dashboards. Dashboards themselves consisted of metrics and only system metrics, mainly CPU, memory, and disk usage. For this reason, we will start with metrics.
Prometheus作为主要的监控解决方案之一,采用拉取模型工作:Prometheus会抓取应用程序兼容端点,并将其内部存储。
我们将利用OTEL Collector抓取Prometheus兼容端点,并将结果输出至控制台。Grafana Labs提供了一个项目,用于生成随机指标以供实验。为简化操作,我将采用Docker Compose进行配置,如下所示:
version: "3"

services:
  fake-metrics:
    build: ./fake-metrics-generator                                         #1
  collector:
    image: otel/opentelemetry-collector:0.87.0                              #2
    environment:                                                            #3
      - METRICS_HOST=fake-metrics
      - METRICS_PORT=5000
    volumes:
- ./config/collector/config.yml:/etc/otelcol/config.yaml:ro #4- 针对该模拟指标项目,并无现成的Docker镜像,因此我们需要自行构建
- 撰写本文时最新的OTEL Collector版本
- 参数化以下配置文件
- 所有操作在此进行
如前所述,OTEL Collector功能强大,因此配置至关重要。
receivers:                                                                  #1
  prometheus:                                                               #2
    config:
      scrape_configs:                                                       #3
        - job_name: fake-metrics                                            #4
          scrape_interval: 3s
          static_configs:
            - targets: [ "${env.METRICS_HOST}:${env.METRICS_PORT}" ]

exporters:                                                                  #5
  logging:                                                                  #6
    loglevel: debug

service:
  pipelines:                                                                #7
    metrics:                                                                #8
      receivers: [ "prometheus" ]                                           #9
exporters: [ "logging" ] #10- 接收器列表。接收器负责读取数据,其方式可以是推送式或拉取式。
- 我们使用预定义的
prometheus接收器 - 定义拉取任务
- 任务配置
- 导出器列表。与接收器相反,导出器负责写入数据。
- 最简单的导出器是将数据写入标准输出
- 管道组合接收器和导出器
- 定义一个与指标相关的管道
- 该管道从前述
prometheus接收器获取数据,并将其发送至logging导出器,即打印出来即
以下是结果示例:
2023-11-11 08:28:54 otel-collector-collector-1     | StartTimestamp: 1970-01-01 00:00:00 +0000 UTC
2023-11-11 08:28:54 otel-collector-collector-1     | Timestamp: 2023-11-11 07:28:54.14 +0000 UTC
2023-11-11 08:28:54 otel-collector-collector-1     | Value: 83.090000
2023-11-11 08:28:54 otel-collector-collector-1     | NumberDataPoints #1
2023-11-11 08:28:54 otel-collector-collector-1     | Data point attributes:
2023-11-11 08:28:54 otel-collector-collector-1     |      -> fake__embrace_world_class_systems: Str(concept)
2023-11-11 08:28:54 otel-collector-collector-1     |      -> fake__exploit_magnetic_applications: Str(concept)
2023-11-11 08:28:54 otel-collector-collector-1     |      -> fake__facilitate_wireless_architectures: Str(extranet)
2023-11-11 08:28:54 otel-collector-collector-1     |      -> fake__grow_magnetic_communities: Str(challenge)
2023-11-11 08:28:54 otel-collector-collector-1     |      -> fake__reinvent_revolutionary_applications: Str(support)
2023-11-11 08:28:54 otel-collector-collector-1     |      -> fake__strategize_strategic_initiatives: Str(internet_solution)
2023-11-11 08:28:54 otel-collector-collector-1     |      -> fake__target_customized_eyeballs: Str(concept)
2023-11-11 08:28:54 otel-collector-collector-1     |      -> fake__transform_turn_key_technologies: Str(framework)
2023-11-11 08:28:54 otel-collector-collector-1     |      -> fake__whiteboard_innovative_partnerships: Str(matrices)
2023-11-11 08:28:54 otel-collector-collector-1     | StartTimestamp: 1970-01-01 00:00:00 +0000 UTC
2023-11-11 08:28:54 otel-collector-collector-1     | Timestamp: 2023-11-11 07:28:54.14 +0000 UTC
2023-11-11 08:28:54 otel-collector-collector-1     | Value: 53.090000
2023-11-11 08:28:54 otel-collector-collector-1     | NumberDataPoints #2
2023-11-11 08:28:54 otel-collector-collector-1     | Data point attributes:
2023-11-11 08:28:54 otel-collector-collector-1     |      -> fake__expedite_distributed_partnerships: Str(approach)
2023-11-11 08:28:54 otel-collector-collector-1     |      -> fake__facilitate_wireless_architectures: Str(graphical_user_interface)
2023-11-11 08:28:54 otel-collector-collector-1     |      -> fake__grow_magnetic_communities: Str(policy)
2023-11-11 08:28:54 otel-collector-collector-1     |      -> fake__reinvent_revolutionary_applications: Str(algorithm)
2023-11-11 08:28:54 otel-collector-collector-1     |      -> fake__transform_turn_key_technologies: Str(framework)
2023-11-11 08:28:54 otel-collector-collector-1     | StartTimestamp: 1970-01-01 00:00:00 +0000 UTC
2023-11-11 08:28:54 otel-collector-collector-1     | Timestamp: 2023-11-11 07:28:54.14 +0000 UTC
2023-11-11 08:28:54 otel-collector-collector-1     | Value: 16.440000
2023-11-11 08:28:54 otel-collector-collector-1     | NumberDataPoints #3
2023-11-11 08:28:54 otel-collector-collector-1     | Data point attributes:
2023-11-11 08:28:54 otel-collector-collector-1     |      -> fake__exploit_magnetic_applications: Str(concept)
2023-11-11 08:28:54 otel-collector-collector-1     |      -> fake__grow_magnetic_communities: Str(graphical_user_interface)
2023-11-11 08:28:54 otel-collector-collector-1     |      -> fake__target_customized_eyeballs: Str(extranet)
超越打印
上述步骤虽好,但远不止于控制台打印。接下来,我们将使指标可供常规Prometheus实例抓取,并可添加Grafana仪表板以图形化展示。尽管初看无意义,请耐心,此仅为过渡步骤。
为实现上述功能,我们仅需调整OTEL Collector配置:
exporters:
  prometheus:                                                               #1
    endpoint: ":${env:PROMETHEUS_PORT}"                                     #2

service:
  pipelines:
    metrics:
      receivers: [ "prometheus" ]
exporters: [ "prometheus" ] #3- 添加
prometheus导出器 - 公开符合Prometheus规范的端点
- 将打印替换为公开
至此,OTEL Collector的灵活性尽显。
注意,Collector支持多输入、多输出。若需同时打印数据并经由端点暴露,我们将其加入管道:
exporters:
  prometheus:                                                               #1
    endpoint: ":${env:PROMETHEUS_PORT}"
  logging:                                                                  #2
    loglevel: debug

service:
  pipelines:
    metrics:
      receivers: [ "prometheus" ]
exporters: [ "prometheus", "logging" ] #3- 公开数据
- 打印数据
- 该流水线将同时输出数据并将其暴露
配置了Prometheus exporter后,我们能在Grafana中可视化指标。
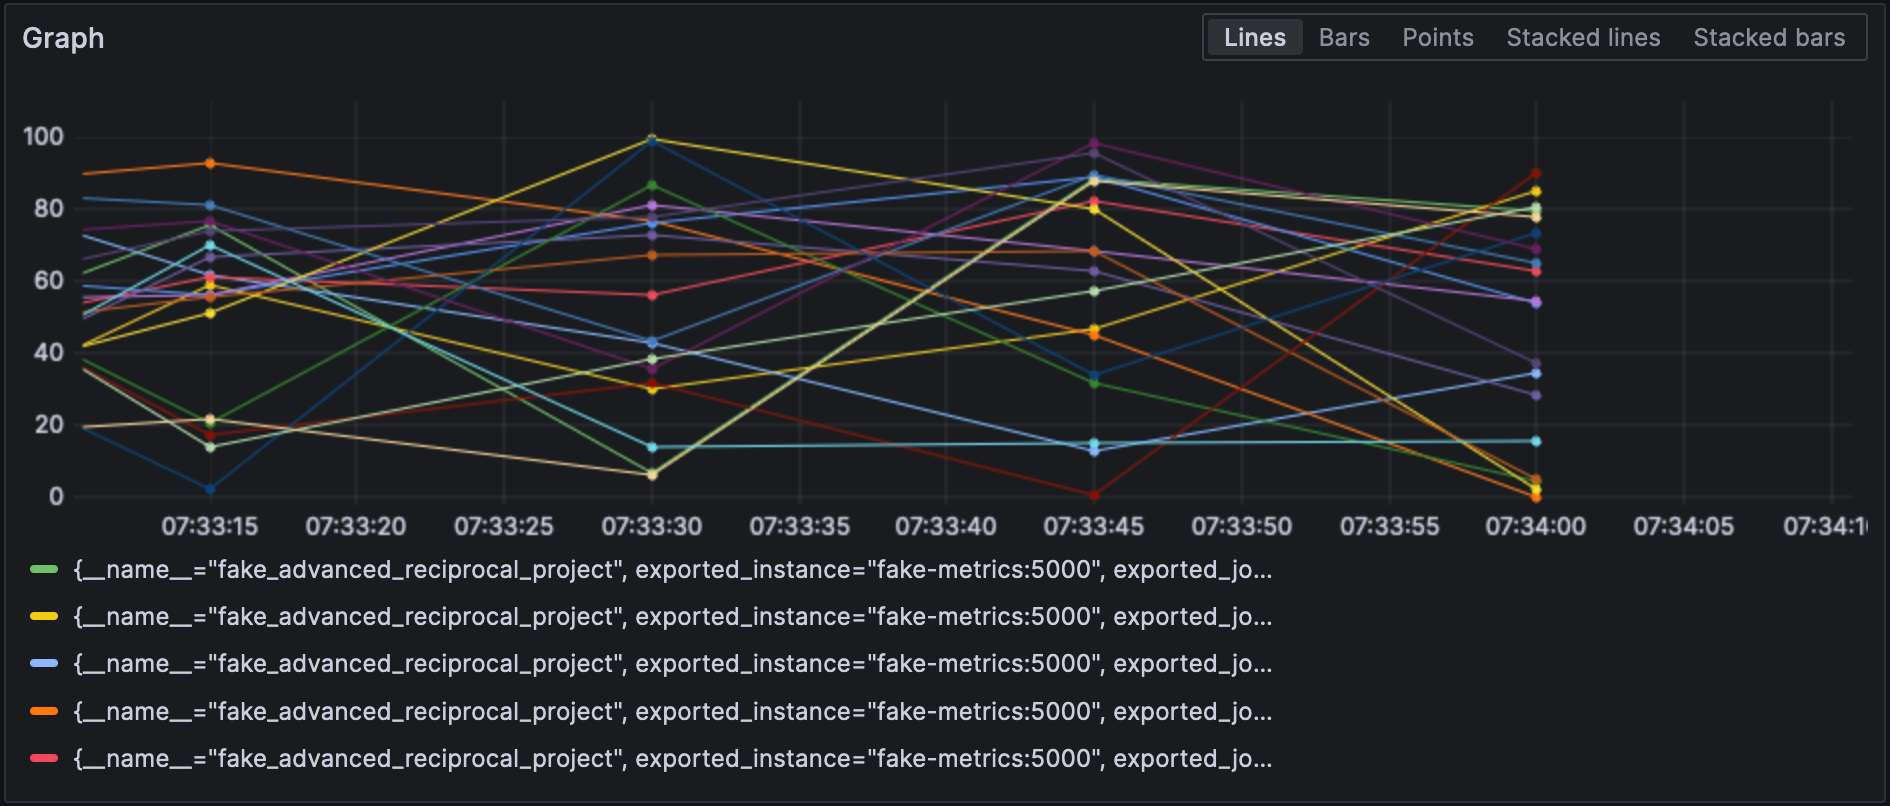
注意,接收器和导出器指定了它们各自的类型以及每个类型都必须唯一。为满足这一要求,我们可以附加一个限定符以区分它们,例如,prometheus/foo和prometheus/bar.
中间数据处理
A valid question would be why the OTEL Collector is set between the source and Prometheus, as it makes the overall design more fragile. At this stage, we can leverage the true power of the OTEL Collector: data processing. So far, we have ingested raw metrics, but the source format may not be adapted to how we want to visualize data. For example, in our setup, metrics come from our fake generator, “business,” and the underlying NodeJS platform, “technical.” It is reflected in the metrics’ name. We could add a dedicated source label and remove the unnecessary prefix to filter more efficiently.
在配置文件的processors部分声明数据处理器。收集器按声明的顺序执行它们。接下来实现上述转换。
迈向目标的第一步是理解收集器有两种版本:一种是“裸”版本,另一种是基于其上的contrib版本。前者的处理器数量和功能都有限;因此,我们需要切换到contrib版本。
collector:
  image: otel/opentelemetry-collector-contrib:0.87.0                        #1
  environment:
    - METRICS_HOST=fake-metrics
    - METRICS_PORT=5000
    - PROMETHEUS_PORT=8889
  volumes:
- ./config/collector/config.yml:/etc/otelcol-contrib/config.yaml:ro #2- 使用
contrib风味 - 更有趣的是,配置文件位于另一个路径
此时,我们可以添加处理器本身:
processors:
  metricstransform:                                                         #1
    transforms:                                                             #2
      - include: ^fake_(.*)$                                                #3
        match_type: regexp                                                  #3
        action: update
        operations:                                                         #4
          - action: add_label                                               #5
            new_label: origin
            new_value: fake
      - include: ^fake_(.*)$
        match_type: regexp
        action: update                                                      #6
        new_name: $${1}                                                     #6-7
# 对NodeJS生成的指标做同样处理- 调用指标转换处理器
- 按顺序应用的转换列表
- 匹配所有定义正则表达式的指标
- 按顺序应用的操作列表
- 添加标签
- 通过移除正则表达式组前缀重命名指标
- 有趣的是:语法是
$${x}
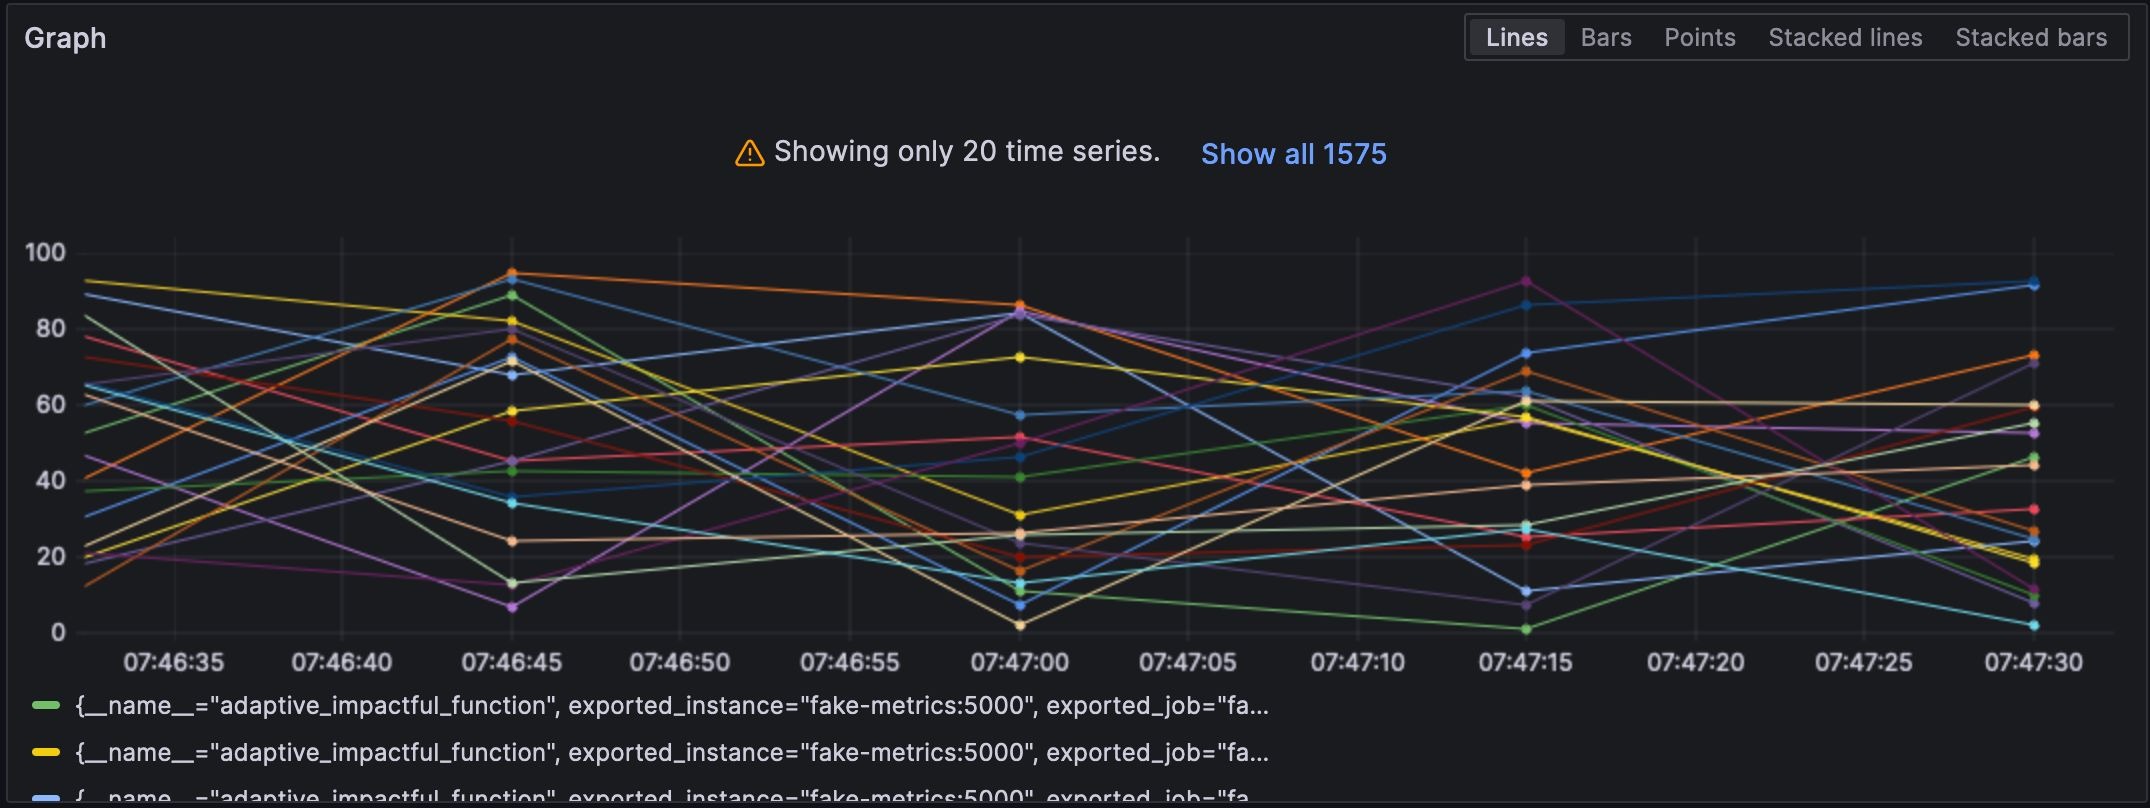
最终,我们将定义的处理器添加到流水线中:
service:
  pipelines:
    metrics:
      receivers: [ "prometheus" ]
      processors: [ "metricstransform" ]
      exporters: [ "prometheus" ]
以下是结果:
连接接收器和导出器
A connector is both a receiver and an exporter and connects two pipelines. The example from the documentation receives the number of spans (tracing) and exports the count, which has a metric. I tried to achieve the same with 500 errors — spoiler: it doesn’t work as intended.
首先,添加一个日志接收器:
receivers:
  filelog:
    include: [ "/var/logs/generated.log" ]
接着,添加一个连接器:
connectors:
  count:
    requests.errors:
      description: Number of 500 errors
      condition: [ "status == 500 " ]
最后,将日志接收器与指标导出器相连:
service:
   pipelines:
     logs:
       receivers: [ "filelog" ]
       exporters: [ "count" ]
     metrics:
receivers: [ "prometheus", "count" ]指标名为log_record_count_total,但其值始终为1。
日志处理
处理器允许数据操作;操作符是专门处理日志的处理器。如果你熟悉ELK堆栈,它们相当于Logstash。
目前,日志时间戳为摄取时间戳。我们将改为创建时间戳。
receivers:
  filelog:
    include: [ "/var/logs/generated.log" ]
    operators:
      - type: json_parser                                                   #1
        timestamp:                                                          #2
          parse_from: attributes.datetime                                   #3
          layout: "%d/%b/%Y:%H:%M:%S %z"                                    #4
        severity:                                                           #2
          parse_from: attributes.status                                     #3
          mapping:                                                          #5
            error: 5xx                                                      #6
            warn: 4xx
            info: 3xx
            debug: 2xx
      - id: remove_body                                                     #7
        type: remove
        field: body
      - id: remove_datetime                                                 #7
        type: remove
        field: attributes.datetime
      - id: remove_status                                                   #7
        type: remove
field: attributes.status- 日志采用JSON格式,我们可以使用提供的JSON解析器
- 要设置的元数据属性
- 要读取的字段
- 解析模式
- 映射表
- 接受一个范围,例如,
501-599。操作符对HTTP状态码有一个特殊的解释值5xx(及类似)。 - 移除重复数据
日志
此时,我们可以将日志发送到任何日志聚合组件。我们将留在Grafana Labs领域并使用Loki。
exporters:
  loki:
    endpoint: "http://loki:3100/loki/api/v1/push"
我们还可以使用收集器本身的日志:
service:
  telemetry:
    logs:
最后,让我们添加另一个管道:
service:
  pipelines:
    logs:
      receivers: [ "filelog" ]
      exporters: [ "loki" ]
Grafana也能可视化日志。选择Loki作为数据源。
结论
在本篇文章中,我们深入探讨了OpenTelemetry收集器。尽管它并非OTEL架构的必需部分,但它确实是你所有数据处理需求的万能瑞士军刀。如果你尚未锁定特定的技术栈或不愿受其限制,它将极大地助力你的工作。
本文完整源代码可在GitHub上找到。
深入学习
Source:
https://dzone.com/articles/exploring-the-opentelemetry-collector