


OpenTelemetry CollectorはOpenTelemetryアーキテクチャの中心に位置しますが、W3C Trace Contextとは関係ありません。私のトレーシングデモでは、Collectorの代わりにJaegerを使用しています。しかし、それは普遍的であり、OpenTelemetryに関連するすべての投稿で見られます。さらに調査したかったのです。
この投稿では、Collectorのさまざまな側面を探ります:
- データの種類:ログ、メトリクス、トレース
- プッシュモデルとプルモデル
- 操作:読み取り、変換、書き込み
最初のステップ
A long time ago, observability as we know it didn’t exist; what we had instead was monitoring. Back then, monitoring was a bunch of people looking at screens displaying dashboards. Dashboards themselves consisted of metrics and only system metrics, mainly CPU, memory, and disk usage. For this reason, we will start with metrics.
Prometheusは主要な監視ソリューションの一つです。プルベースのモデルで動作します:Prometheusはアプリケーションの互換性のあるエンドポイントをスクレイピングし、内部に保存します。
OTEL Collectorを使用してPrometheus互換エンドポイントをスクレイピングし、コンソールに結果を出力します。Grafana Labsはプロジェクトを提供し、ランダムなメトリクスを生成して遊ぶことができます。簡単にするために、Docker Composeを使用します。設定は以下のようになります:
version: "3"

services:
  fake-metrics:
    build: ./fake-metrics-generator                                         #1
  collector:
    image: otel/opentelemetry-collector:0.87.0                              #2
    environment:                                                            #3
      - METRICS_HOST=fake-metrics
      - METRICS_PORT=5000
    volumes:
- ./config/collector/config.yml:/etc/otelcol/config.yaml:ro #4- 偽のメトリクスプロジェクトのDockerイメージは利用できないため、ビルドする必要があります
- 執筆時点でのOTEL Collectorの最新バージョン
- 以下の設定ファイルをパラメータ化します
- すべてがここで起こります
上記の通り、OTEL Collectorは多くのことができます。したがって、設定がすべてです。
receivers:                                                                  #1
  prometheus:                                                               #2
    config:
      scrape_configs:                                                       #3
        - job_name: fake-metrics                                            #4
          scrape_interval: 3s
          static_configs:
            - targets: [ "${env.METRICS_HOST}:${env.METRICS_PORT}" ]

exporters:                                                                  #5
  logging:                                                                  #6
    loglevel: debug

service:
  pipelines:                                                                #7
    metrics:                                                                #8
      receivers: [ "prometheus" ]                                           #9
exporters: [ "logging" ] #10- 受信者リスト。受信者はデータを読み取り、プッシュベースまたはプルベースのいずれかです。
- 事前定義された
prometheus受信者を使用します - プルジョブの定義
- ジョブの設定
- エクスポーターリスト。受信者とは対照的に、エクスポーターはデータを書き込みます。
- 最も単純なエクスポーターは標準出力にデータを書き込むことです
- パイプラインは受信者とエクスポーターを組み合わせます
- メトリック関連のパイプラインの定義
- パイプラインは以前に定義された
prometheus受信者からデータを取得し、loggingエクスポーターに送信し、すなわち、それらを印刷します
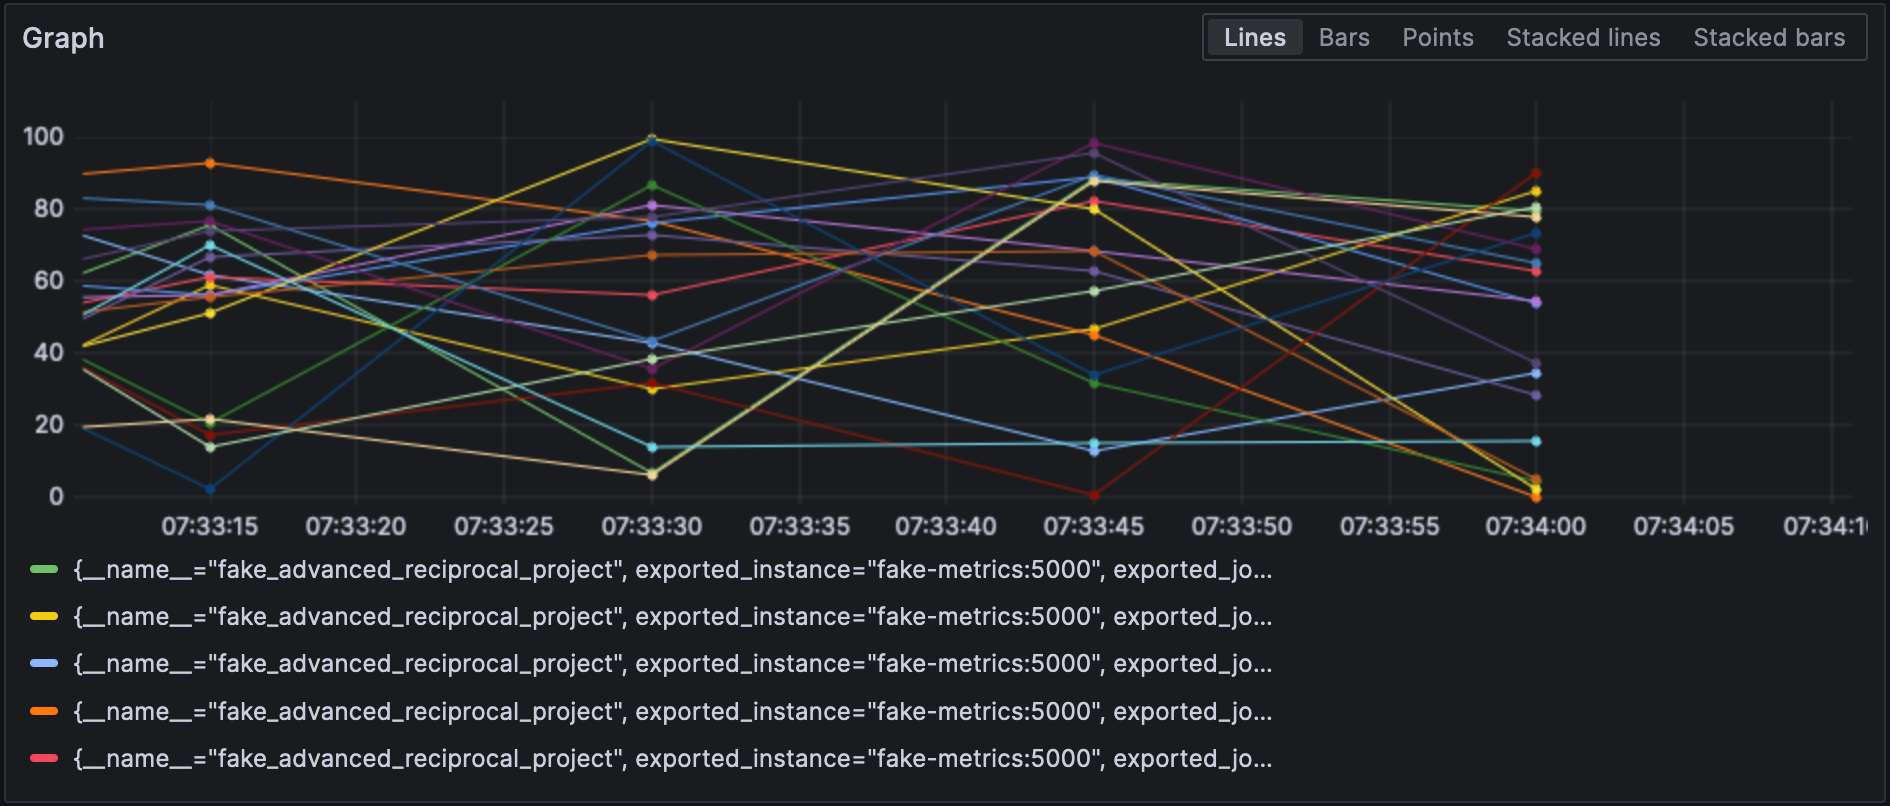
結果のサンプルは次の通りです。
2023-11-11 08:28:54 otel-collector-collector-1     | StartTimestamp: 1970-01-01 00:00:00 +0000 UTC
2023-11-11 08:28:54 otel-collector-collector-1     | Timestamp: 2023-11-11 07:28:54.14 +0000 UTC
2023-11-11 08:28:54 otel-collector-collector-1     | Value: 83.090000
2023-11-11 08:28:54 otel-collector-collector-1     | NumberDataPoints #1
2023-11-11 08:28:54 otel-collector-collector-1     | Data point attributes:
2023-11-11 08:28:54 otel-collector-collector-1     |      -> fake__embrace_world_class_systems: Str(concept)
2023-11-11 08:28:54 otel-collector-collector-1     |      -> fake__exploit_magnetic_applications: Str(concept)
2023-11-11 08:28:54 otel-collector-collector-1     |      -> fake__facilitate_wireless_architectures: Str(extranet)
2023-11-11 08:28:54 otel-collector-collector-1     |      -> fake__grow_magnetic_communities: Str(challenge)
2023-11-11 08:28:54 otel-collector-collector-1     |      -> fake__reinvent_revolutionary_applications: Str(support)
2023-11-11 08:28:54 otel-collector-collector-1     |      -> fake__strategize_strategic_initiatives: Str(internet_solution)
2023-11-11 08:28:54 otel-collector-collector-1     |      -> fake__target_customized_eyeballs: Str(concept)
2023-11-11 08:28:54 otel-collector-collector-1     |      -> fake__transform_turn_key_technologies: Str(framework)
2023-11-11 08:28:54 otel-collector-collector-1     |      -> fake__whiteboard_innovative_partnerships: Str(matrices)
2023-11-11 08:28:54 otel-collector-collector-1     | StartTimestamp: 1970-01-01 00:00:00 +0000 UTC
2023-11-11 08:28:54 otel-collector-collector-1     | Timestamp: 2023-11-11 07:28:54.14 +0000 UTC
2023-11-11 08:28:54 otel-collector-collector-1     | Value: 53.090000
2023-11-11 08:28:54 otel-collector-collector-1     | NumberDataPoints #2
2023-11-11 08:28:54 otel-collector-collector-1     | Data point attributes:
2023-11-11 08:28:54 otel-collector-collector-1     |      -> fake__expedite_distributed_partnerships: Str(approach)
2023-11-11 08:28:54 otel-collector-collector-1     |      -> fake__facilitate_wireless_architectures: Str(graphical_user_interface)
2023-11-11 08:28:54 otel-collector-collector-1     |      -> fake__grow_magnetic_communities: Str(policy)
2023-11-11 08:28:54 otel-collector-collector-1     |      -> fake__reinvent_revolutionary_applications: Str(algorithm)
2023-11-11 08:28:54 otel-collector-collector-1     |      -> fake__transform_turn_key_technologies: Str(framework)
2023-11-11 08:28:54 otel-collector-collector-1     | StartTimestamp: 1970-01-01 00:00:00 +0000 UTC
2023-11-11 08:28:54 otel-collector-collector-1     | Timestamp: 2023-11-11 07:28:54.14 +0000 UTC
2023-11-11 08:28:54 otel-collector-collector-1     | Value: 16.440000
2023-11-11 08:28:54 otel-collector-collector-1     | NumberDataPoints #3
2023-11-11 08:28:54 otel-collector-collector-1     | Data point attributes:
2023-11-11 08:28:54 otel-collector-collector-1     |      -> fake__exploit_magnetic_applications: Str(concept)
2023-11-11 08:28:54 otel-collector-collector-1     |      -> fake__grow_magnetic_communities: Str(graphical_user_interface)
2023-11-11 08:28:54 otel-collector-collector-1     |      -> fake__target_customized_eyeballs: Str(extranet)
印刷を超えて
上記は素晴らしい第一歩ですが、コンソールへの印刷以上のことがあります。メトリクスを定期的なPrometheusインスタンスによってスクレイプ可能にし、Grafanaダッシュボードを追加してそれらを可視化できます。無意味に見えるかもしれませんが、それは一歩前進です。
上記を達成するために、OTELコレクタの設定を変更するだけです。
exporters:
  prometheus:                                                               #1
    endpoint: ":${env:PROMETHEUS_PORT}"                                     #2

service:
  pipelines:
    metrics:
      receivers: [ "prometheus" ]
exporters: [ "prometheus" ] #3prometheusエクスポーターを追加- Prometheus互換のエンドポイントを公開
- 印刷を公開に置き換える
以上です。OTELコレクタは非常に柔軟です。
コレクタはマルチインプット、マルチアウトプットであることに注意してください。データを印刷し、エンドポイント経由で公開するために、パイプラインに追加します。
exporters:
  prometheus:                                                               #1
    endpoint: ":${env:PROMETHEUS_PORT}"
  logging:                                                                  #2
    loglevel: debug

service:
  pipelines:
    metrics:
      receivers: [ "prometheus" ]
exporters: [ "prometheus", "logging" ] #3- データを公開
- データを印刷
- パイプラインはデータを出力し、それらを公開します
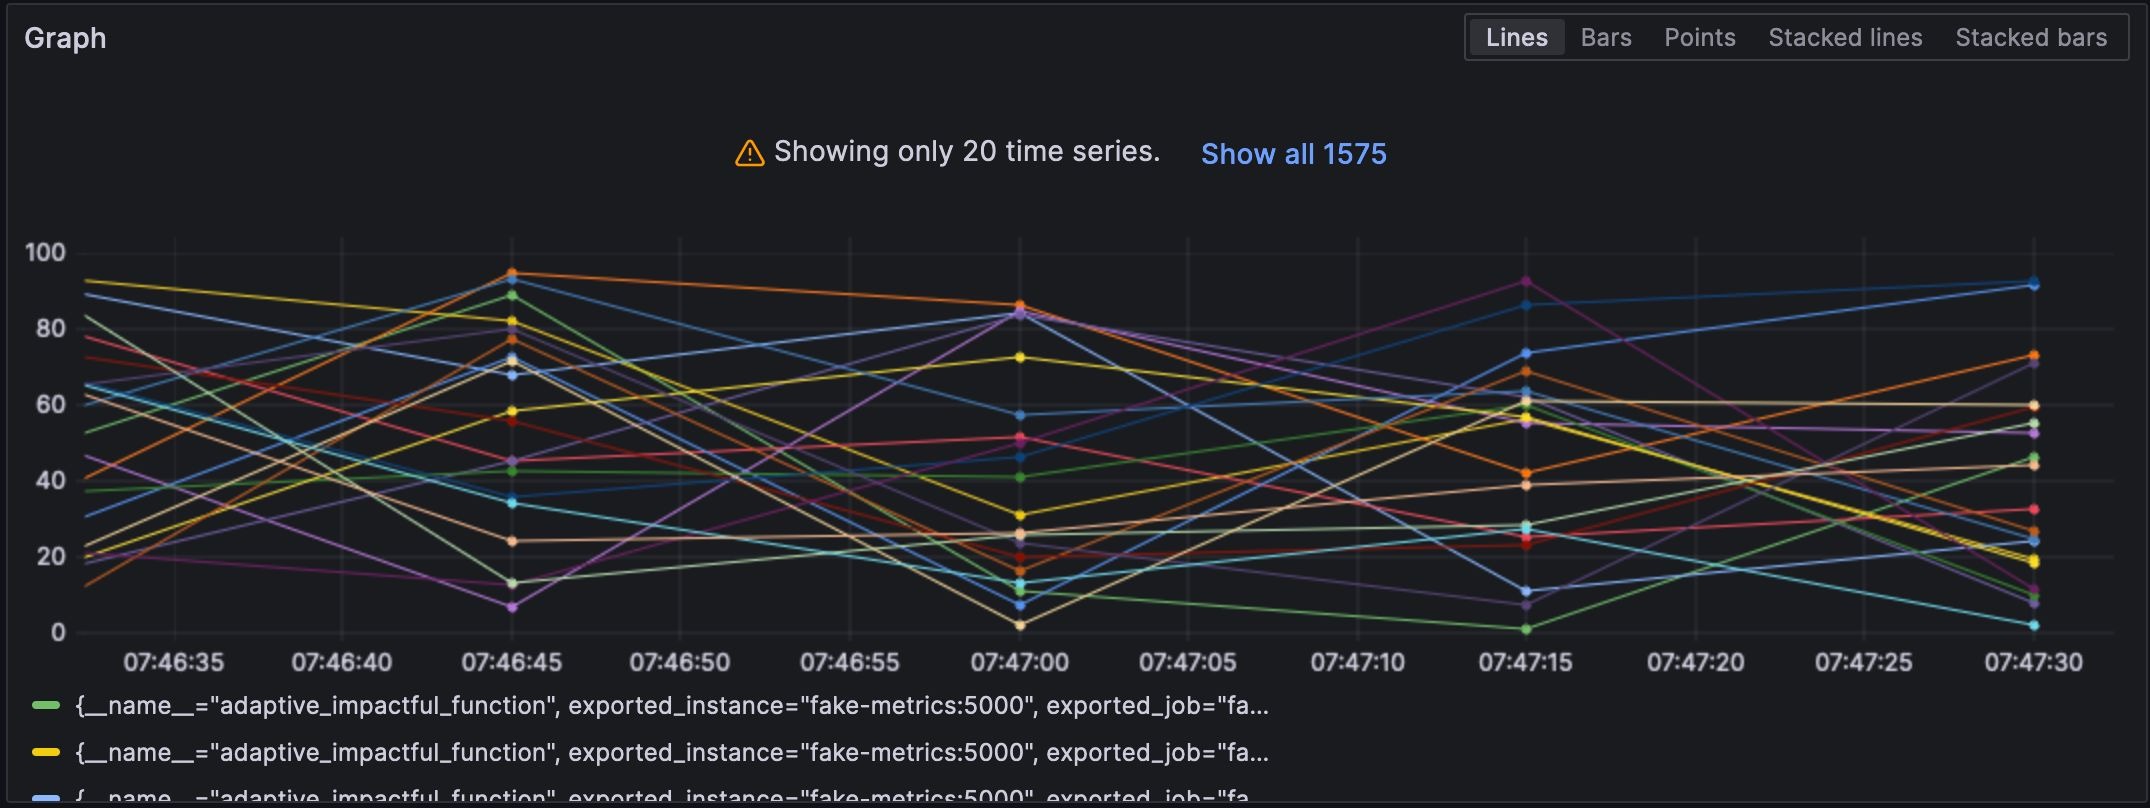
Prometheusエクスポーターを設定することで、Grafanaでメトリクスを可視化できます。
リセッターとエクスポーターはそれぞれのタイプを指定し、そしてそれぞれが一意であることが必須です。最後の要件に従うために、識別子を追加してそれらを区別できます。例えば、prometheus/fooとprometheus/barのようにです。
中間データ処理
A valid question would be why the OTEL Collector is set between the source and Prometheus, as it makes the overall design more fragile. At this stage, we can leverage the true power of the OTEL Collector: data processing. So far, we have ingested raw metrics, but the source format may not be adapted to how we want to visualize data. For example, in our setup, metrics come from our fake generator, “business,” and the underlying NodeJS platform, “technical.” It is reflected in the metrics’ name. We could add a dedicated source label and remove the unnecessary prefix to filter more efficiently.
データプロセッサーは設定ファイルのprocessorsセクションで宣言します。コレクターは宣言された順序でそれらを実行します。上記の変換を実装してみましょう。
目標に向かう最初のステップは、コレクターには「ベア」版と、それをベースにしたcontrib版の2つのバージョンがあることを理解することです。前者に含まれるプロセッサーは、数も機能も限られているため、contribバージョンに切り替える必要があります。
collector:
  image: otel/opentelemetry-collector-contrib:0.87.0                        #1
  environment:
    - METRICS_HOST=fake-metrics
    - METRICS_PORT=5000
    - PROMETHEUS_PORT=8889
  volumes:
- ./config/collector/config.yml:/etc/otelcol-contrib/config.yaml:ro #2- 使用する
contribフレーバー - さらに楽しみを加えるために、設定ファイルは別のパスにあります
この時点で、プロセッサー自体を追加できます。
processors:
  metricstransform:                                                         #1
    transforms:                                                             #2
      - include: ^fake_(.*)$                                                #3
        match_type: regexp                                                  #3
        action: update
        operations:                                                         #4
          - action: add_label                                               #5
            new_label: origin
            new_value: fake
      - include: ^fake_(.*)$
        match_type: regexp
        action: update                                                      #6
        new_name: $${1}                                                     #6-7
# NodeJSによって生成されたメトリクスにも同じことを行います- メトリクス変換プロセッサーを呼び出します
- 順番に適用される変換リスト
- 定義された正規表現に一致するすべてのメトリクス
- 順番に適用される操作リスト
- ラベルを追加します
- 正規表現グループのプレフィックスを削除してメトリックをリネームします
- 楽しいこと:構文は
$${x}です
最後に、定義されたプロセッサーをパイプラインに追加します。
service:
  pipelines:
    metrics:
      receivers: [ "prometheus" ]
      processors: [ "metricstransform" ]
      exporters: [ "prometheus" ]
ここに結果があります:
リージョンとエクスポーターの接続
A connector is both a receiver and an exporter and connects two pipelines. The example from the documentation receives the number of spans (tracing) and exports the count, which has a metric. I tried to achieve the same with 500 errors — spoiler: it doesn’t work as intended.
まず、ログリージョンを追加しましょう:
receivers:
  filelog:
    include: [ "/var/logs/generated.log" ]
次に、コネクタを追加します:
connectors:
  count:
    requests.errors:
      description: Number of 500 errors
      condition: [ "status == 500 " ]
最後に、ログリージョンとメトリックエクスポーターを接続します:
service:
   pipelines:
     logs:
       receivers: [ "filelog" ]
       exporters: [ "count" ]
     metrics:
receivers: [ "prometheus", "count" ]メトリックの名前はlog_record_count_totalですが、その値は1のままです。
ログ操作
プロセッサーはデータ操作を可能にし、オペレーターはログに対して機能する特殊なプロセッサーです。ELKスタックに精通している場合、それらはLogstashと同等です。
現時点では、ログのタイムスタンプは取り込みタイムスタンプです。作成時のタイムスタンプに変更しましょう。
receivers:
  filelog:
    include: [ "/var/logs/generated.log" ]
    operators:
      - type: json_parser                                                   #1
        timestamp:                                                          #2
          parse_from: attributes.datetime                                   #3
          layout: "%d/%b/%Y:%H:%M:%S %z"                                    #4
        severity:                                                           #2
          parse_from: attributes.status                                     #3
          mapping:                                                          #5
            error: 5xx                                                      #6
            warn: 4xx
            info: 3xx
            debug: 2xx
      - id: remove_body                                                     #7
        type: remove
        field: body
      - id: remove_datetime                                                 #7
        type: remove
        field: attributes.datetime
      - id: remove_status                                                   #7
        type: remove
field: attributes.status- ログはJSON形式であるため、提供されたJSONパーサーを使用できます
- 設定するメタデータ属性
- 読み取るフィールド
- パーサーパターン
- マッピングテーブル
- 範囲を受け入れる、例えば、
501-599。オペレーターはHTTPステータスの特別な解釈された値5xx(および同様のもの)を持っています。 - 重複データを削除
ログ
この時点で、ログを任意のログ集約コンポーネントに送信できます。Grafana Labsのスペースに留まり、Lokiを使用しましょう。
exporters:
  loki:
    endpoint: "http://loki:3100/loki/api/v1/push"
コレクター自体からのログも使用できます。
service:
  telemetry:
    logs:
最後に、別のパイプラインを追加しましょう。
service:
  pipelines:
    logs:
      receivers: [ "filelog" ]
      exporters: [ "loki" ]
Grafanaはログも可視化できます。データソースとしてLokiを選択してください。
結論
この投稿では、OpenTelemetryコレクターについて掘り下げました。OTELアーキテクチャの必須部分ではありませんが、データ処理のニーズに対する便利なスイスアーミーナイフです。特定のスタックに縛られていない場合やそうしたくない場合は、大いに役立ちます。
この投稿の完全なソースコードはGitHubで見ることができます。
さらに進むために
Source:
https://dzone.com/articles/exploring-the-opentelemetry-collector