


Introduction
Effective monitoring of Redis databases is essential for maintaining optimal performance, identifying potential bottlenecks, and ensuring overall system reliability. Redis Exporter Service is a robust utility designed to monitor Redis databases using Prometheus.
This tutorial will guide you through the complete setup and configuration of Redis Exporter Service, ensuring you establish a monitoring solution seamlessly. By following this tutorial, you’ll achieve a fully operational monitoring setup to effectively monitor the performance metrics of your Redis database.
Note: The approximate setup time for this tutorial is around 25 minutes
Prerequisites
Before you begin, make sure you have the following prerequisites in place:
- You’ll need to have Redis database servers set up and running on a Ubuntu Droplet. You can refer to our tutorials on How to Install and Secure Redis on Ubuntu. The servers you want to monitor should be accessible from the machine where you plan to install Redis Exporter Service.
- You’ll need SSH access to Redis servers to install and configure Redis Exporter Service.
- Prometheus MySQL Exporter integrates with Prometheus for metrics scraping and Grafana for visualization. Here we are using Prometheus and Grafana images from DigitalOcean Marketplace to monitor the database Droplets.
Note: In this tutorial, we will walk through two different methods to set up Redis Exporter Service for monitoring Redis databases. You can choose between manual configuration and script-based automation, each tailored to different preferences and operational requirements. Follow the instructions for each method to deploy Redis Exporter Service on your infrastructure effectively. This flexibility allows you to select the best deployment strategy and operational workflow approach.
Method 1: Manual Configuration
Let’s proceed with the manual configuration method in this section.
Create Prometheus System User and Group
Create a system user and group named “prometheus” to manage the exporter service.
Download and Install Redis Exporter
Download the latest release of Redis Exporter from GitHub, extract the downloaded files, and move the binary to the /usr/local/bin/ directory.
Verify Redis Exporter Installation
Here is the sample Output:

Configure systemd Service for Redis Exporter
Create a systemd service unit file to manage the Redis Exporter service.
Add the following content to the file:
Reload systemd and Start Redis Exporter Service
Configuring the Prometheus Droplet (Manual Method)
Let’s configure the Prometheous droplet for the manual configuration.
Take a backup of the prometheus.yml file
Add the Redis Exporter endpoints to be scraped
Log in to your Prometheus server and add the Redis Exporter endpoints to be scraped.
Replace the IP addresses and ports with your Redis Exporter endpoints (9121 is the default port for Redis Exporter Service).
This is the end of the manual configuration. Now, let’s proceed with the script-based configuration.
Method 2: Configuring Using Scripts
You can also achieve this by running two scripts – one for the target droplets and the other for the Prometheus droplet.
Let’s start by configuring the Target Droplets.
SSH into the Target Droplet.
Download the Target Configuration script by using the following command:
Once the script is downloaded, ensure it has executable permissions by running:
Execute the script by running:
The configuration is complete.
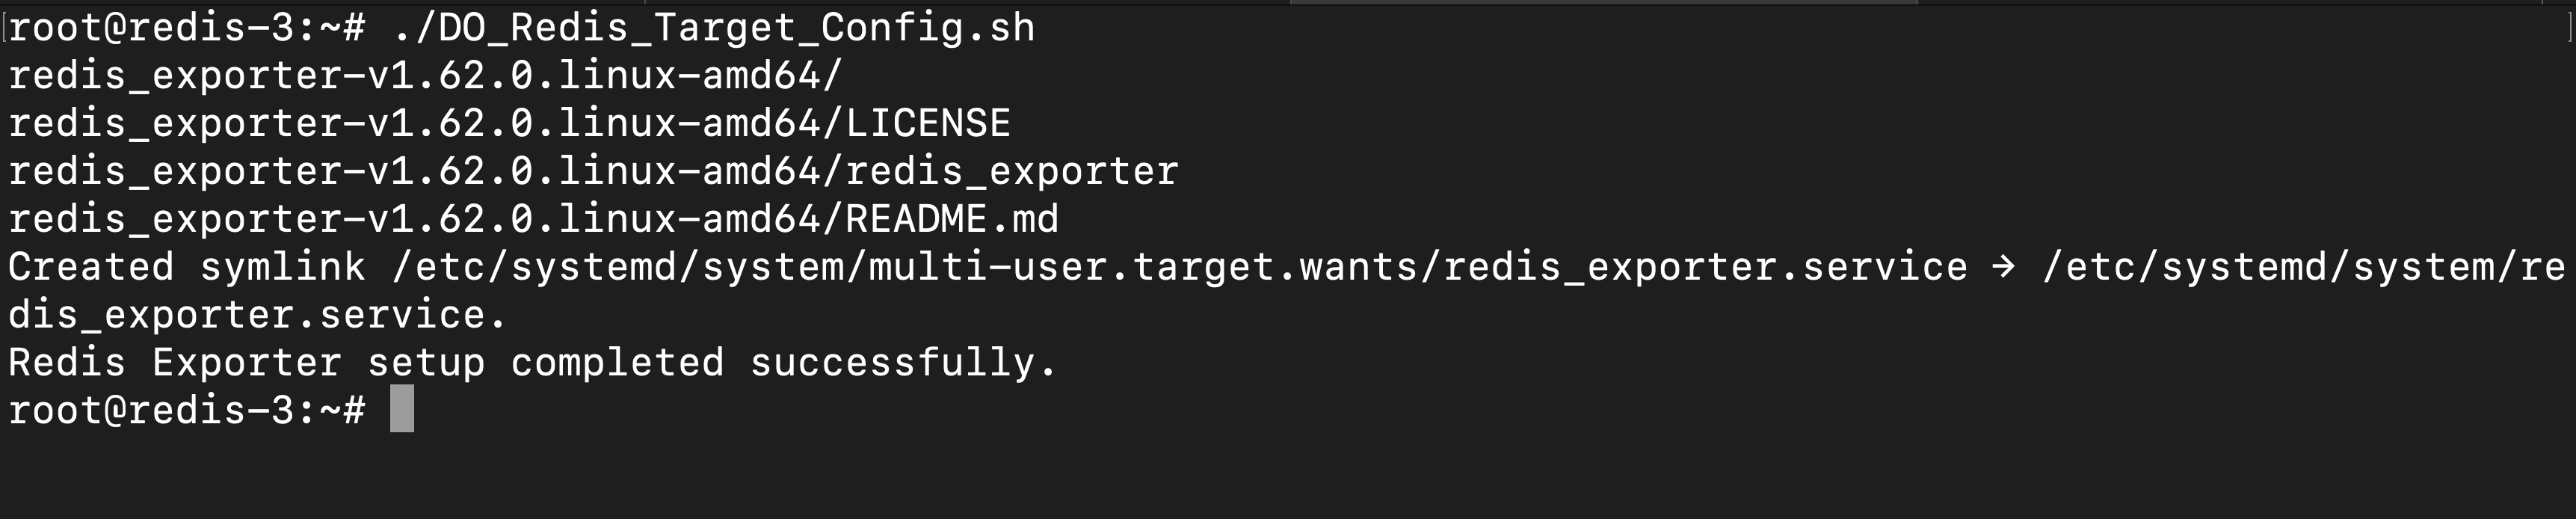
Note: If the redis_exporter.service file already exists, the script will not run.

Configuring the Prometheus Droplet (Script Method)
SSH into the Prometheus Droplet and download the script by using the following command:
Once the script is downloaded, ensure it has executable permissions by running:
Execute the script by running:
Enter the number of Droplets to add to monitoring.
Enter the hostnames and IP addresses.
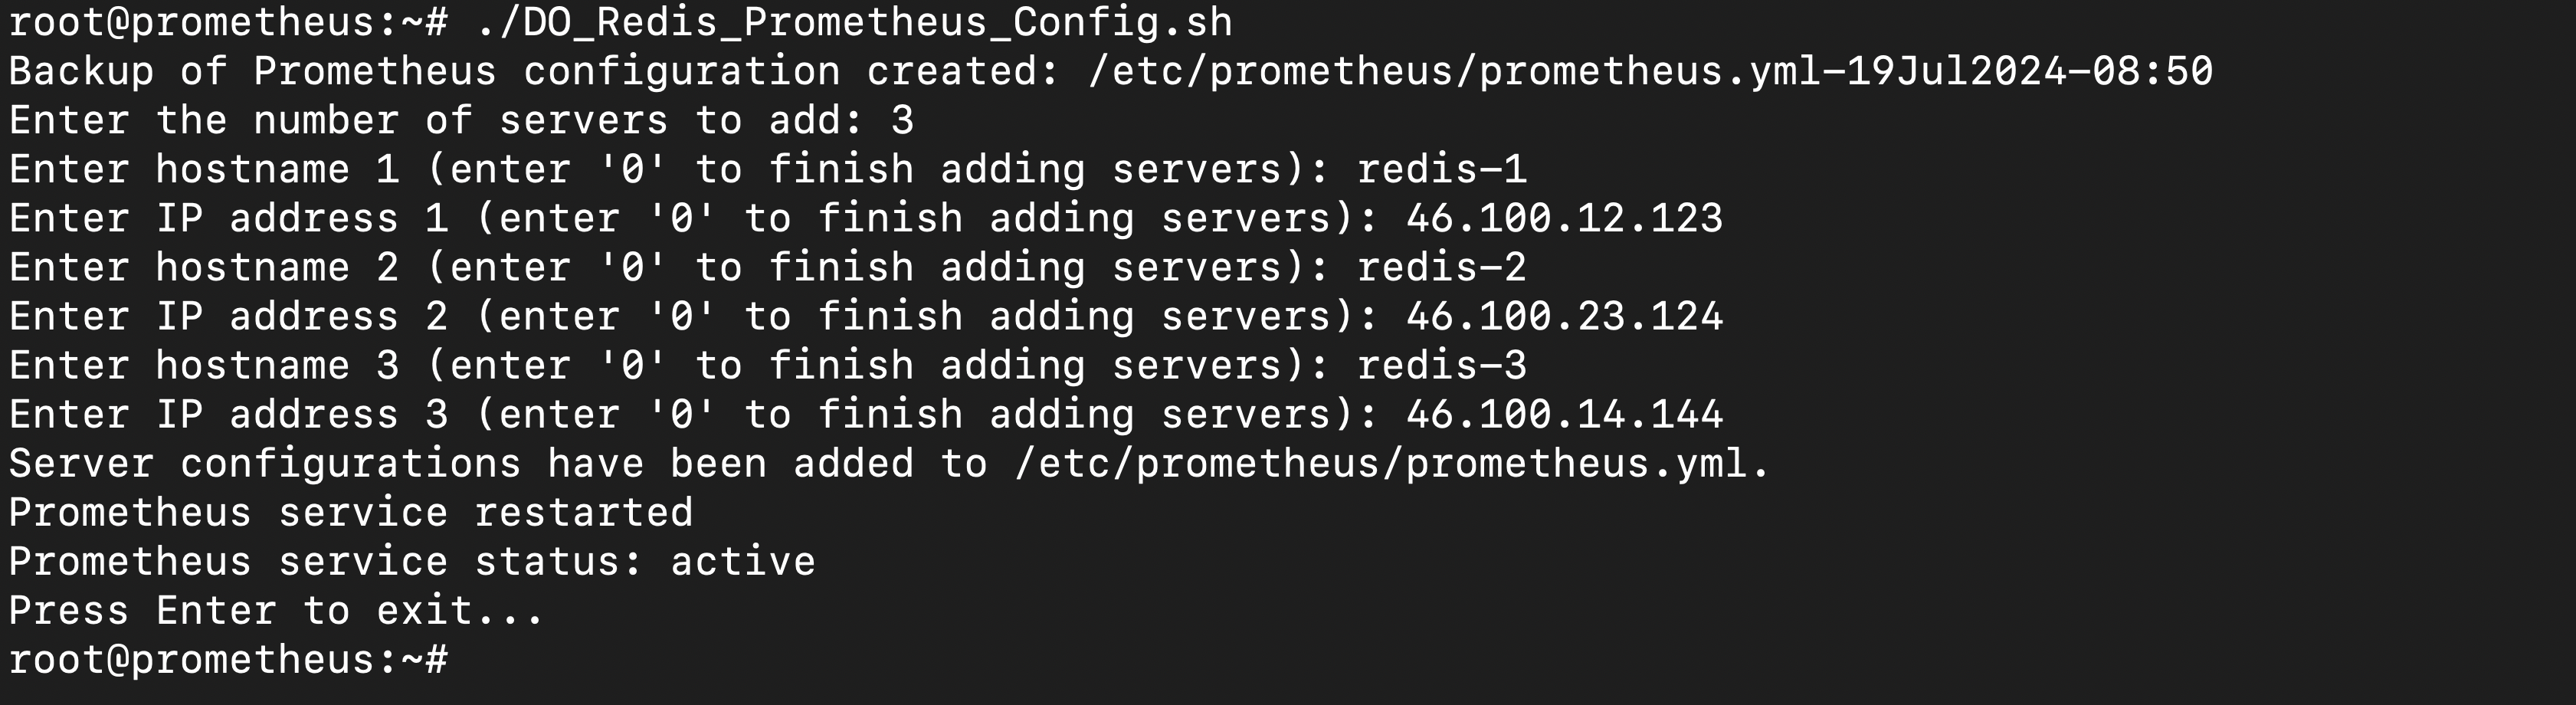
The configuration is complete.
Once added, check whether the targets are updated by accessing the URL prometheushostname:9090/targets.
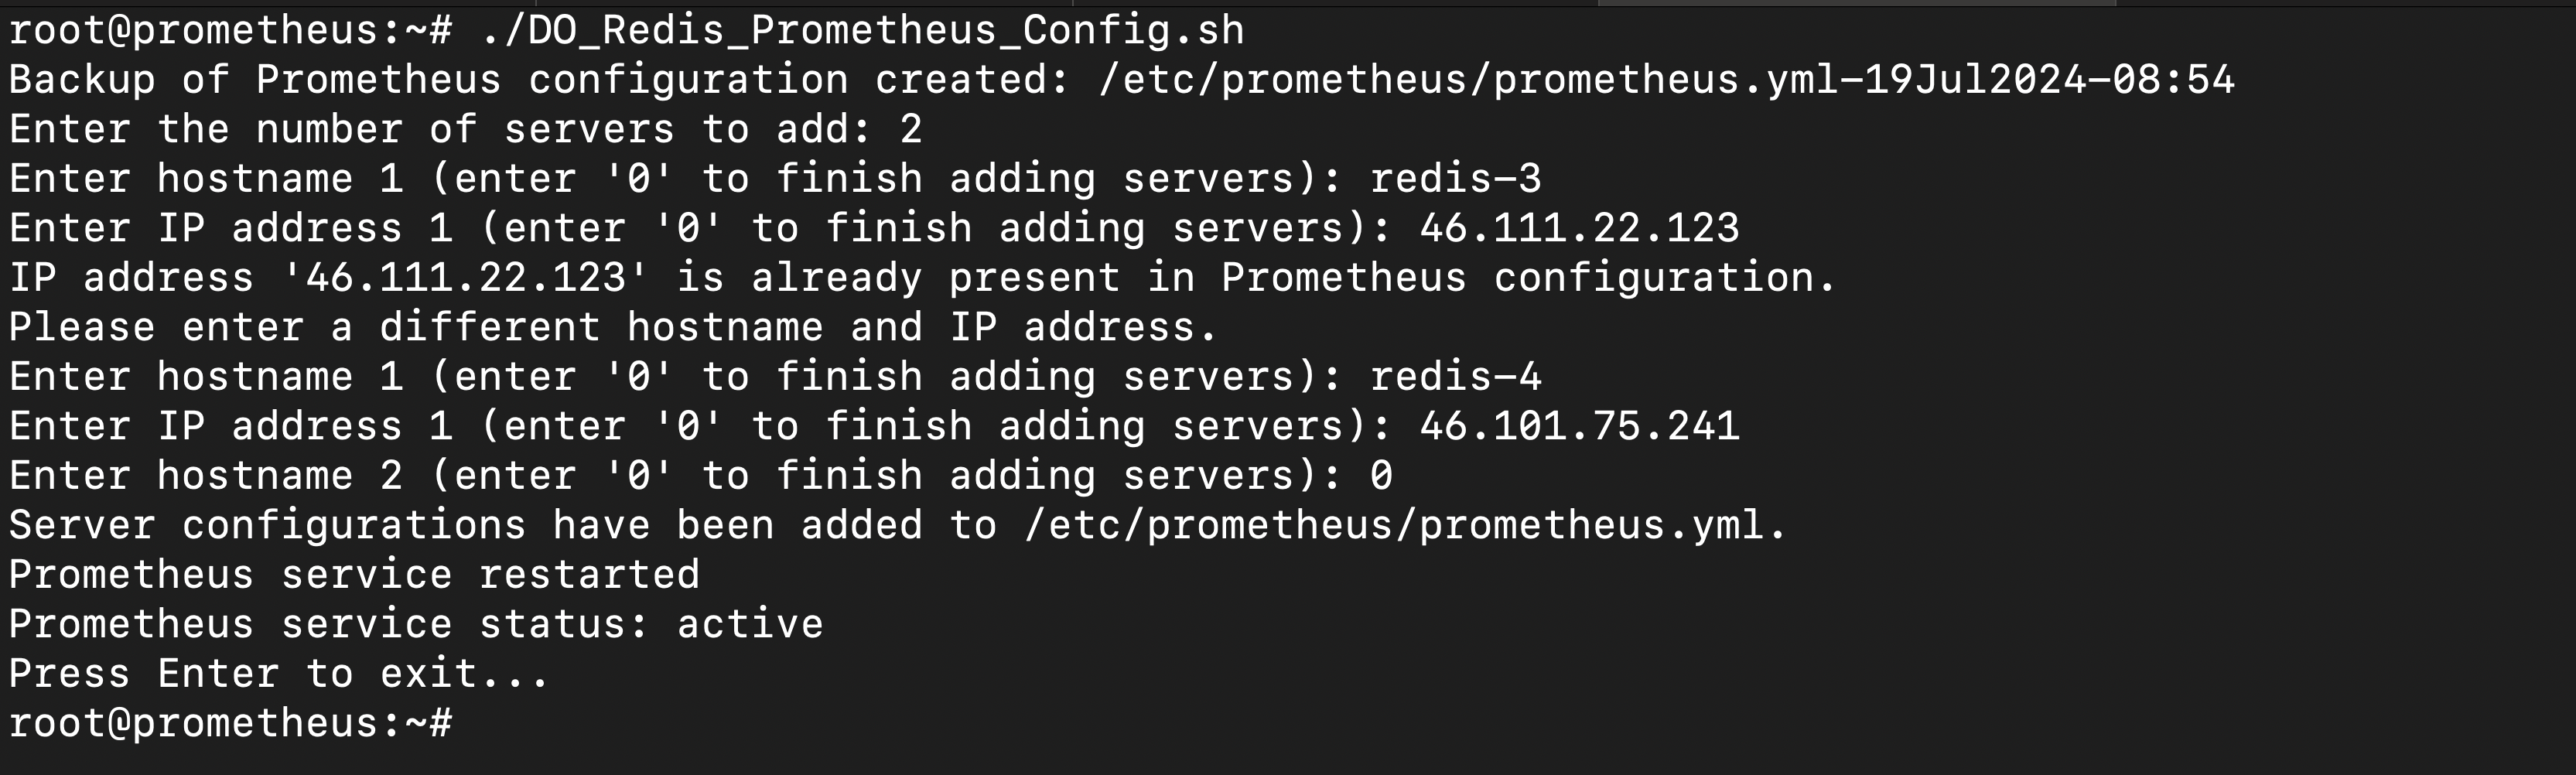
Note: If you enter an IP address already added to the monitoring, you will be asked to enter the details again. Also, if you do not have any more servers to add, you can enter 0 to exit the script
Configuring Grafana
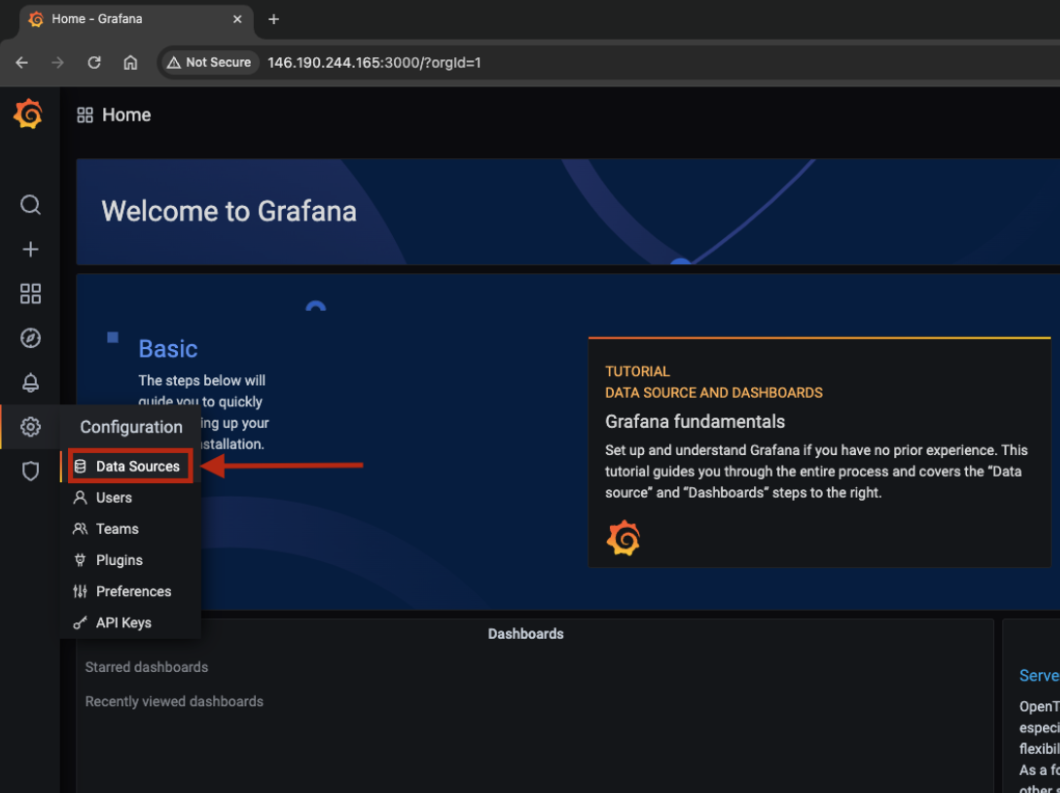
Log into the Grafana dashboard by visiting Grafana-IP:3000 on a browser.
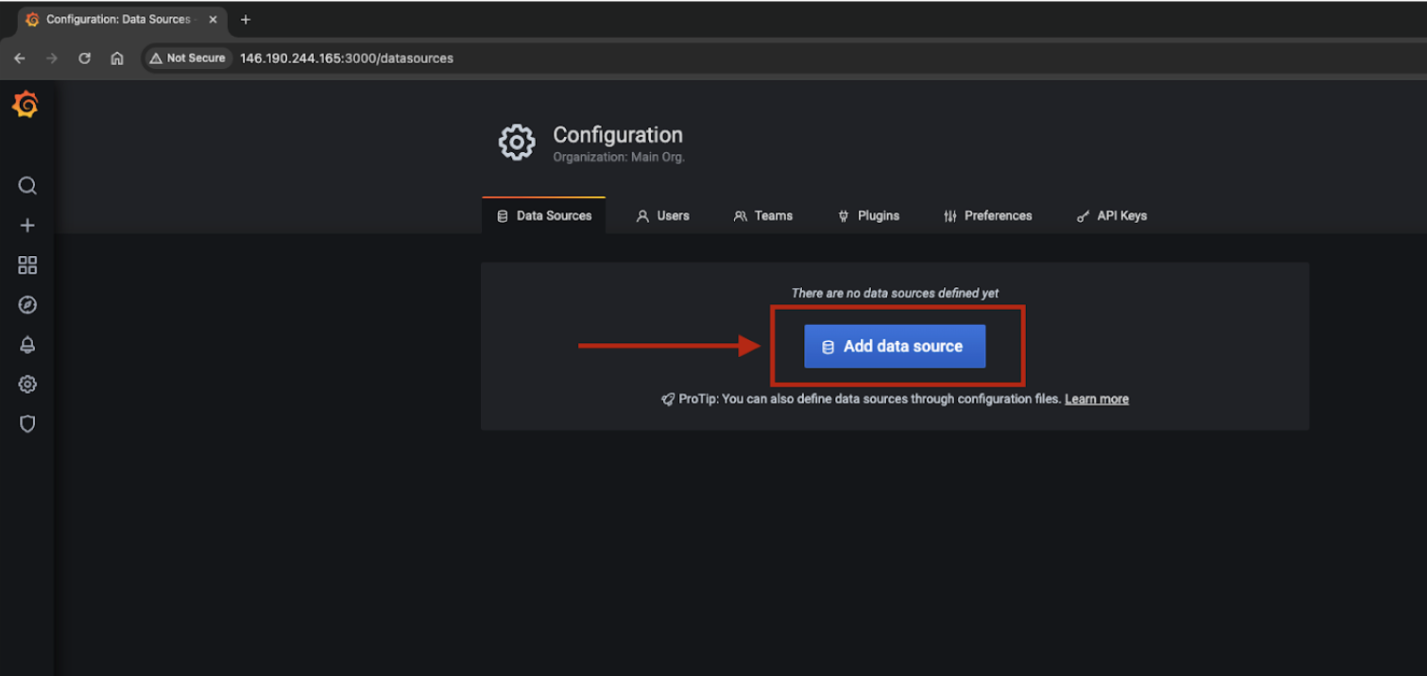
Go to Configuration > Data Sources.
Click on Add data source.
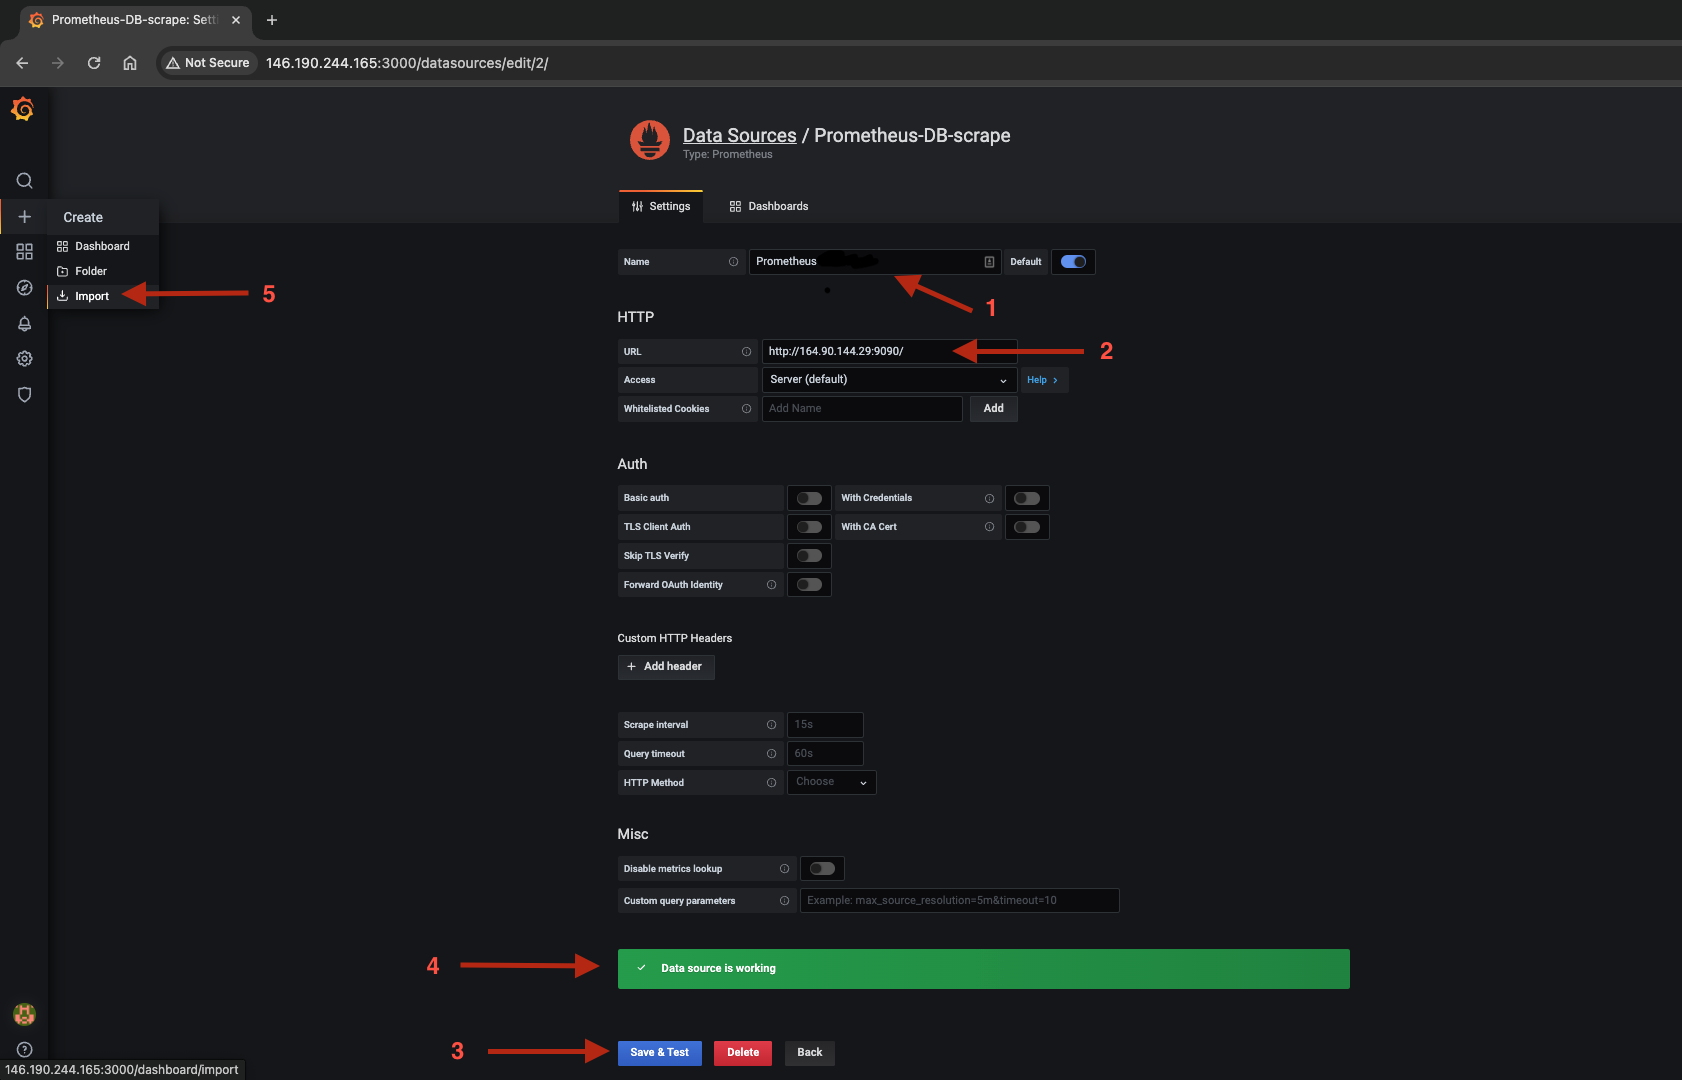
Search and Select Prometheus.

Enter Name as Prometheus, and URL (Prometheushostname:9090) and click “Save & Test”. If you see “Data source is working”, you have successfully added the data source. Once done, go to Create > Import.
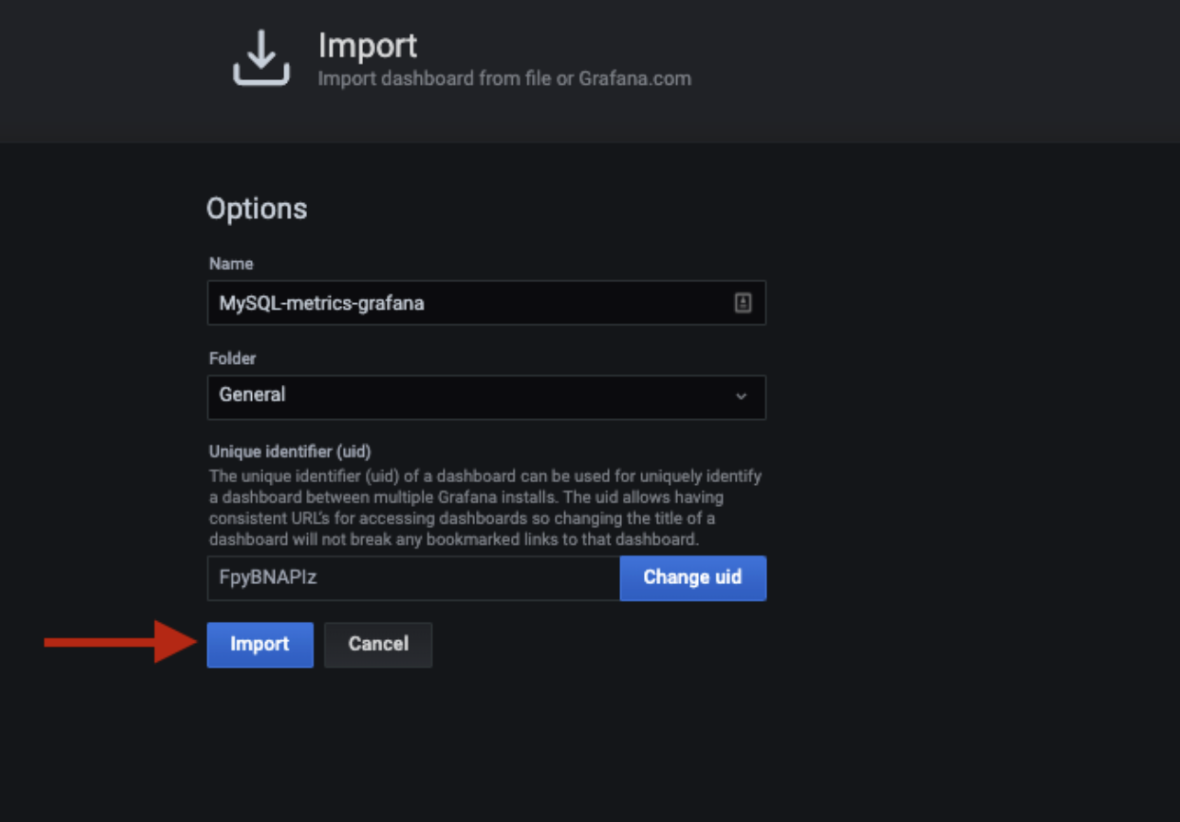
You can manually configure the dashboard or import the dashboard by uploading the JSON file. A JSON template for Redis monitoring can be found in the below link:
Fill in the fields and Import.
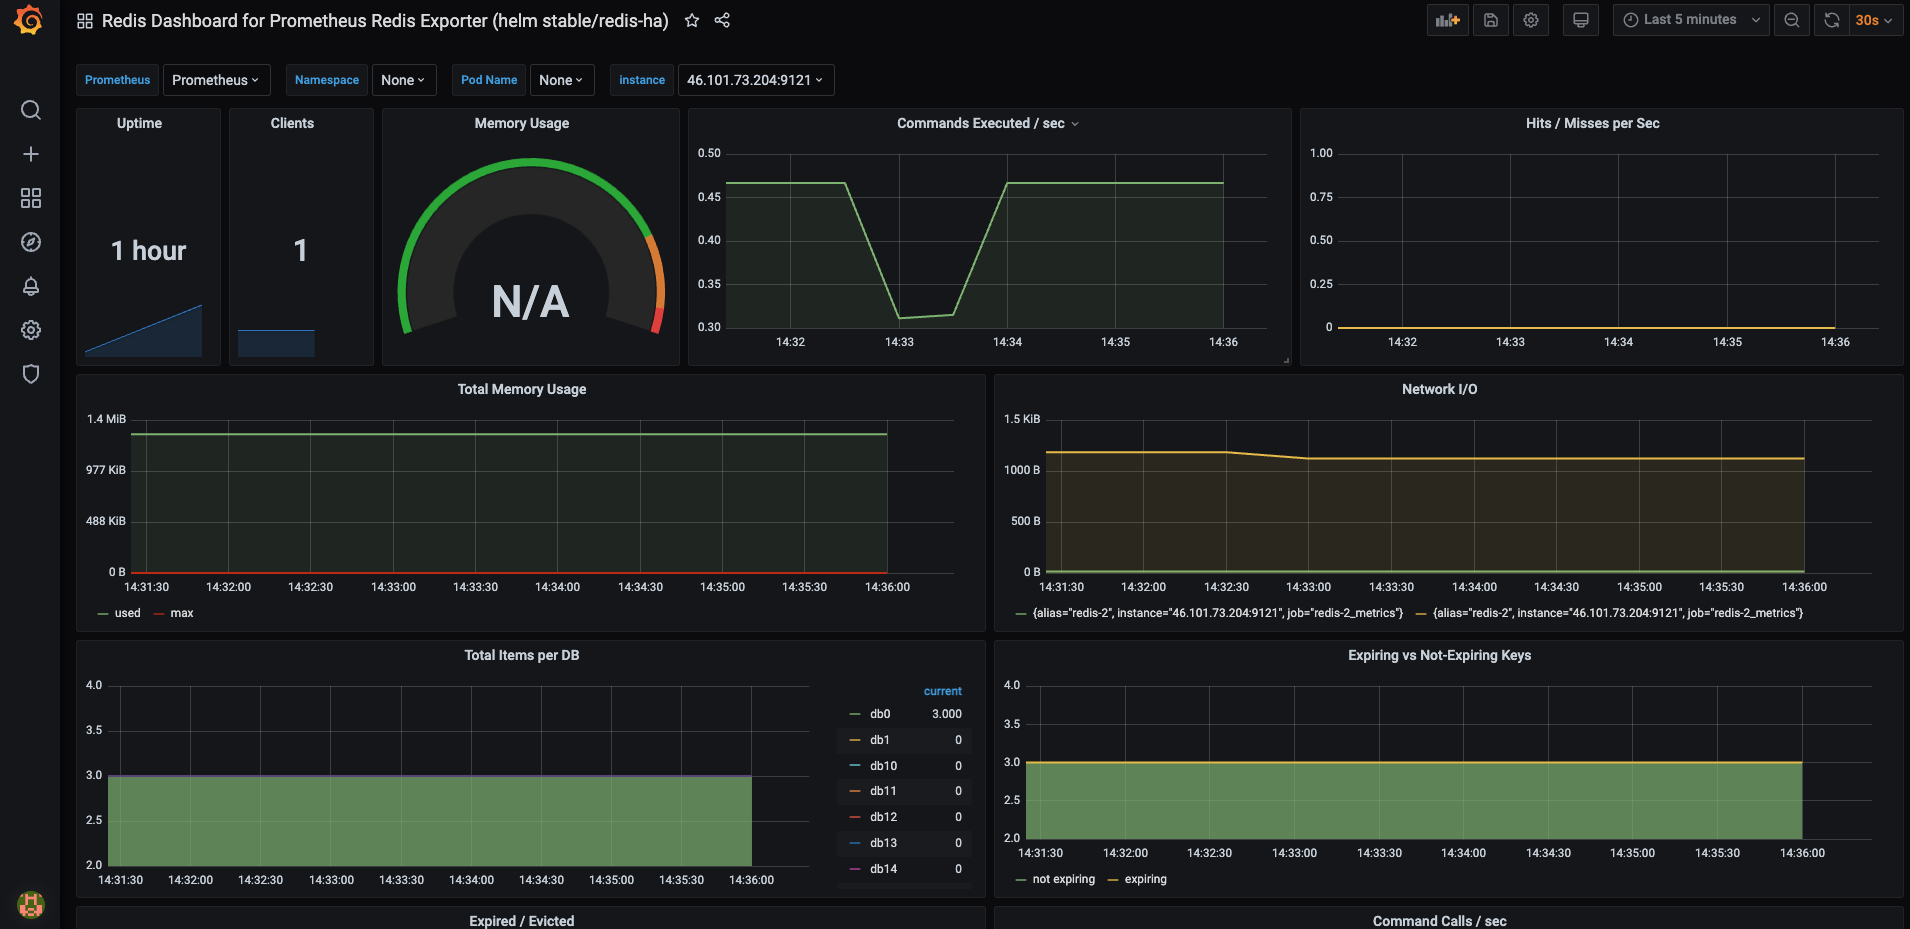
The Grafana dashboard is ready. Select the host and check if the metrics are visible. Please feel free to modify and edit the dashboard as needed.
Conclusion
In this tutorial, you learned to automate the deployment of the Redis Exporter on your servers. The script begins by checking if the redis_exporter.service unit file already exists and exits if it does, avoiding redundant setups. It then creates a Prometheus system user and group for secure service isolation. The script downloads and installs the Redis Exporter binaries, placing them in /usr/local/bin/ for standardization.
Next, it generates and configures a system unit file (redis_exporter.service), specifying essential settings and restarting policies. The script reloads systemd to apply the new configuration, enables the service to start at boot, and starts it immediately.
By automating these steps, the script simplifies the deployment process, minimizes human error, and ensures a consistent setup across servers, providing an efficient solution for integrating Redis metrics into your Prometheus monitoring infrastructure.
As a next step, you can also refer to our tutorial on Monitoring MySQL and MariaDB Droplets Using Prometheus MySQL Exporter.
Source:
https://www.digitalocean.com/community/tutorials/monitor-redis-droplet-using-redis-exporter